 GEXfocus
Indicators developed to interpret delta flow and price.
NDF and FEP are indicators developed by GEXfocus to translate options market activity into an operational reading of the underlying. Their objective is to provide real context around confirmation, bias, exhaustion and equilibrium zones in stocks, ETFs and indices. Each can be used independently, but their combined reading makes it possible to understand the relationship between price, flow and market structure with much greater precision.
A delta flow monitor to contrast hedging and price during the session.
NDF was developed by GEXfocus to track the behavior of delta flow derived from options activity, calculated from monitoring the full options flow stream, and compare it with the path of the underlying in real time.
The value of NDF lies in observing whether the price move is being supported by flow pressure or whether it is starting to separate from it. When price and flow move in the same direction, the reading tends to be one of confirmation. When price tries to extend but flow loses conviction or turns first, a sign of structural wear appears and deserves attention.
This approach makes it possible to work the session with a logic different from that of the chart in isolation. Instead of looking only at candles, support or momentum, NDF adds a layer of interpretation based on what is happening behind the underlying through the options market, following the full flow entering through the chain during the session.
That is why its reading is primarily designed for trading stocks, ETFs and indices. Even so, where these indicators tend to perform best is in indices, due to the high liquidity concentrated in 0DTE and the depth of their options chain. The practical application still lies in understanding the movement of the underlying asset more clearly.
If price and flow align, the move gains support and the intraday reading tends to be cleaner.
If price rises or falls without support from flow, the impulse may be losing consistency.
Divergences between flow and price help detect stretches where the extension begins to weaken.
It is oriented toward reading the underlying, not replicating complex strategies on individual options.
The chart seeks to show when price is moving with flow and when it begins to detach from it.
The visual reading of NDF prioritizes the relationship between price path, flow magnitude and intraday divergences.
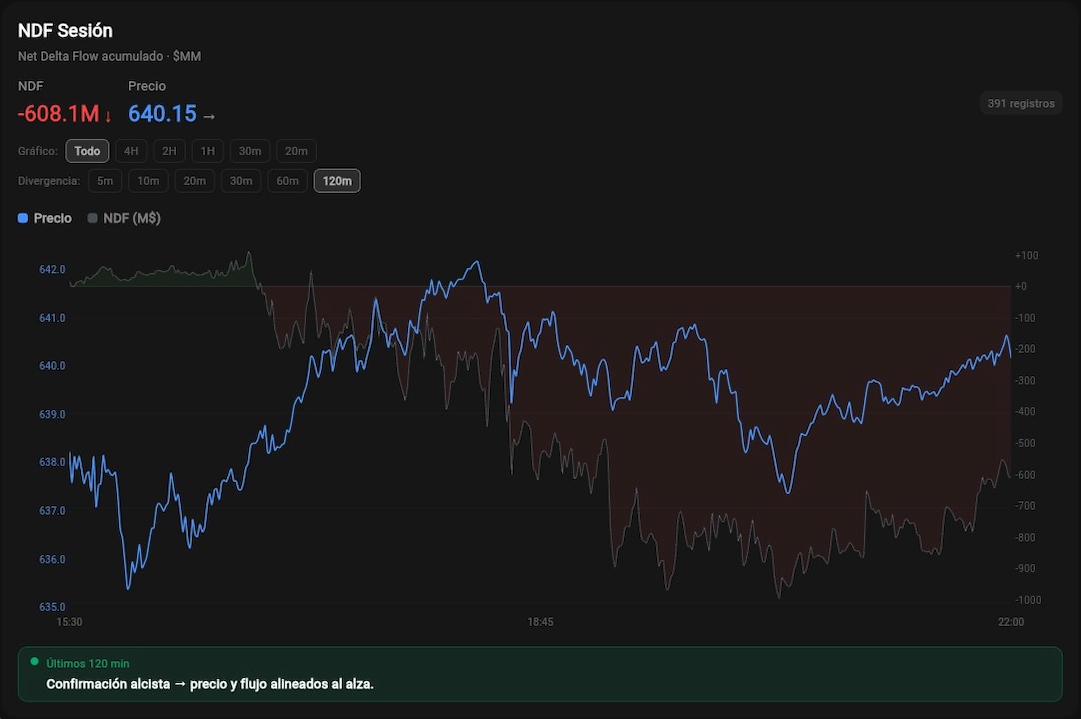
Panel designed to monitor accumulated Net Delta Flow against underlying price and detect confirmation or divergence during specific session windows.
The value of NDF is not in an isolated number, but in the sequence. The trader can assess whether a breakout has support, whether a reversal is starting to attract flow or whether a price displacement is running out of structural backing.
In fast market contexts, that extra layer helps filter moves that look strong on screen but do not show the same conviction when observed through the market’s implied hedging behavior.
Flow Equilibrium Price: a synthetic reference for bias and liquidity zones.
FEP summarizes where the most relevant directional pressure of delta flow was concentrated throughout the session and turns that information into a clear operational reference for price.
FEP can be understood as an equilibrium price built on the magnitude of flow. It does not seek to replace classic tools such as VWAP, but to provide a different reference: where derivatives market conviction was concentrated when flow had the most weight.
This makes it possible to interpret whether the underlying is trading above or below its flow equilibrium. When price holds above it, the reading tends to favor relative strength. When it trades below it, the context is more fragile and requires a different reading of continuation, rebound or confirmation.
In practice, FEP works on its own as a liquidity zone, bias reference and intraday equilibrium point. At the same time, when combined with NDF, it makes the reading of the move much richer.
Price above FEP suggests relative strength; price below FEP suggests relative weakness.
It helps decide whether a signal should be read as continuation, mean reversion or an still incomplete breakout.
It summarizes zones where flow had greater conviction and therefore greater structural relevance.
It can be used on its own as an operational equilibrium reference, although together with NDF its reading gains much more depth.
A synthetic way to express where the most relevant flow of the session was concentrated.
FEP summarizes the average price weighted by flow magnitude, giving greater weight to moments when the directional pressure of the market had more intensity.
Where NDF_i represents the Net Delta Flow of each intraday snapshot and Price_i corresponds to the price of the underlying at that moment. Weighting by absolute value makes it possible to highlight the stretches where flow had the greatest weight during the session.
If price is trading above FEP, the market is above its flow equilibrium, which may favor relative strength readings and greater sensitivity for longs.
If price is trading below FEP, the market is below its flow equilibrium, which suggests relative weakness. In that scenario, aggressive long signals tend to look closer to mean reversion and shorts require greater confirmation.
An equilibrium line to read whether price is trading with an advantage or with fragility relative to flow.
The FEP chart is designed to show immediately the relationship between traded price and its accumulated flow equilibrium.
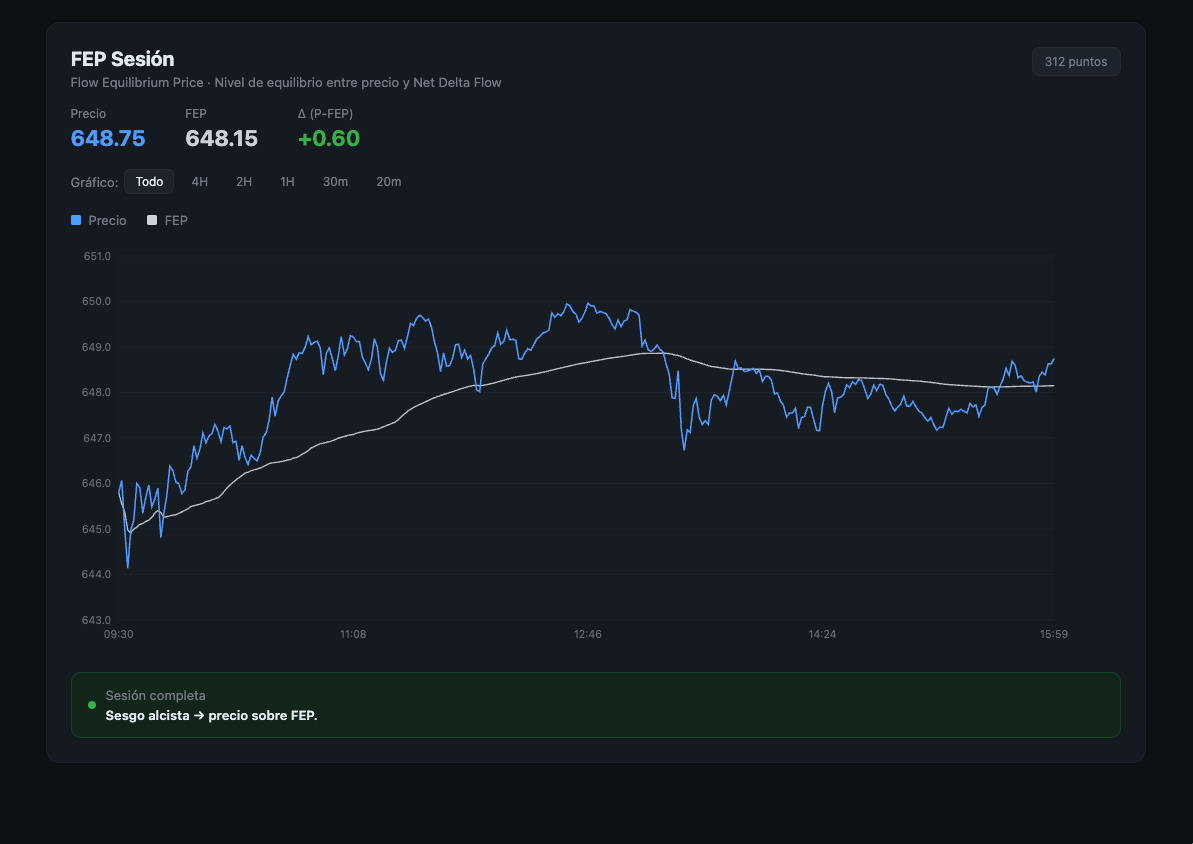
Panel designed to compare the underlying price with its Flow Equilibrium Price to define bias, relative strength and zones where the market can recover or lose traction.
NDF tells you whether flow supports or contradicts the move. FEP places you relative to the accumulated equilibrium of that flow. Together they make it possible to read continuation, exhaustion and intraday context changes more clearly.
The combination is especially useful when price moves away from its equilibrium without a clear acceleration in flow, or when it reclaims FEP with growing support from NDF.
Indicators designed for the underlying: stocks, ETFs and indices.
Although they are born from the options market, their reading is designed to improve decisions on the underlying during the session. Their main focus is on indices, where 0DTE liquidity and options chain depth allow for a more consistent reading of flow.
The value of these indicators lies in translating information from the derivatives market into a more useful operational reading of the underlying. That means they can complement decision-making in indices, ETFs and stocks with an additional structural logic, although their most natural terrain remains index tracking.
This is not about fully replacing other tools, but about incorporating a different source of context: how delta flow is accumulating and expressing itself while price attempts to move. The effectiveness of the approach depends largely on two variables: the real liquidity of 0DTE and the quality or depth of the options chain available for the asset.
This approach is consistent with GEXfocus’s philosophy: using the options market as an explanatory and anticipatory layer for price behavior, not as a universe separate from the main chart.
This is where these indicators usually show their best version, due to 0DTE liquidity and the depth of the options chain.
They make it possible to work intraday context with a reading that complements pure price.
Their application depends much more on there being sufficient options activity, real liquidity and a chain capable of reflecting flow properly.
They are not magical shortcuts; they work best as a reading and confirmation structure, especially when the asset offers liquidity and a sufficiently robust options chain.
The essentials to understand what NDF and FEP do and what they do not do.
This reading is centered on delta flow, intraday context and underlying behavior.
What is NDF?
It is an indicator developed by GEXfocus to track delta flow during the session and contrast it with the price movement of the underlying.
What is FEP or PEF?
It is the Flow Equilibrium Price, a synthetic reference weighted by NDF magnitude to interpret intraday bias, equilibrium and liquidity zones.
Are they useful for trading options directly?
Their main use is in reading stocks, ETFs and indices. The origin of the flow is the options market, but the practical application is on the underlying.
What does NDF try to detect?
It seeks to detect confirmations and divergences between delta flow and price in order to identify exhaustion, continuation or weakness in the move.
Is FEP useful independently?
Yes. It can work as a bias reference, liquidity zone and intraday equilibrium point even when observed separately.
Why combine NDF and FEP?
Because one measures whether flow is accompanying the move and the other places price relative to its accumulated equilibrium. Together they provide a more complete intraday reading.
Proprietary indicators to read the underlying with more context.
NDF and FEP are part of GEXfocus’s approach to better interpret the relationship between flow, structure and price. Each adds value on its own, but their combined reading makes it possible to work intraday with a much stronger foundation.